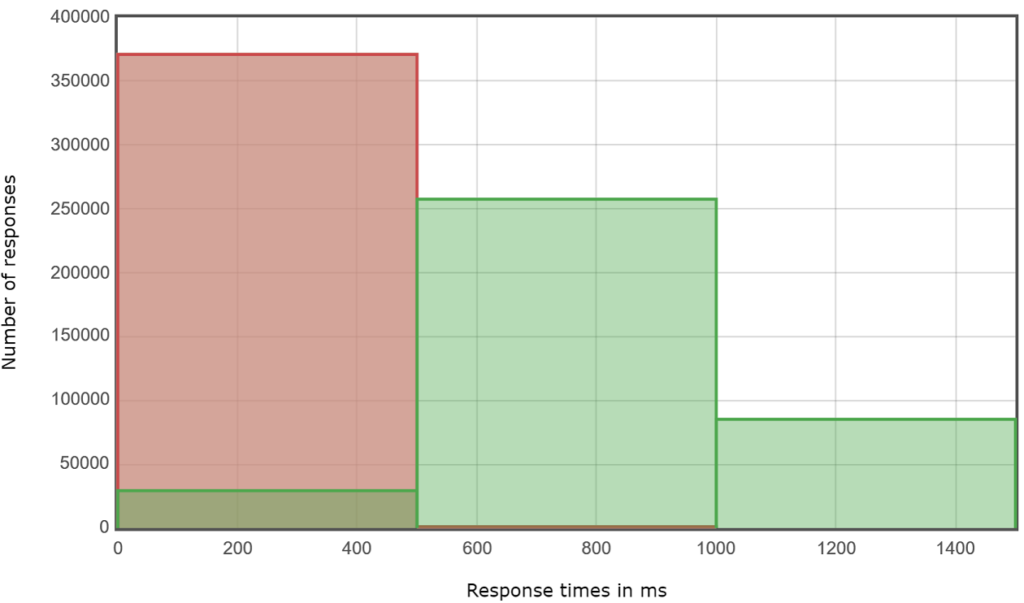
When you run a load test on RedLine13, you have the option of capturing and computing response time percentiles data. In order to enable percentiles for your load test you will have to tick the “Save Response Output and Calculate Percentiles” checkbox prior to running your load test. Selecting this option requires a paid subscription.

Viewing Percentiles within RedLine13
We display this information in two places on your load test report. The first and most prominent area is the top row within the “Summary” section (blue boxes):
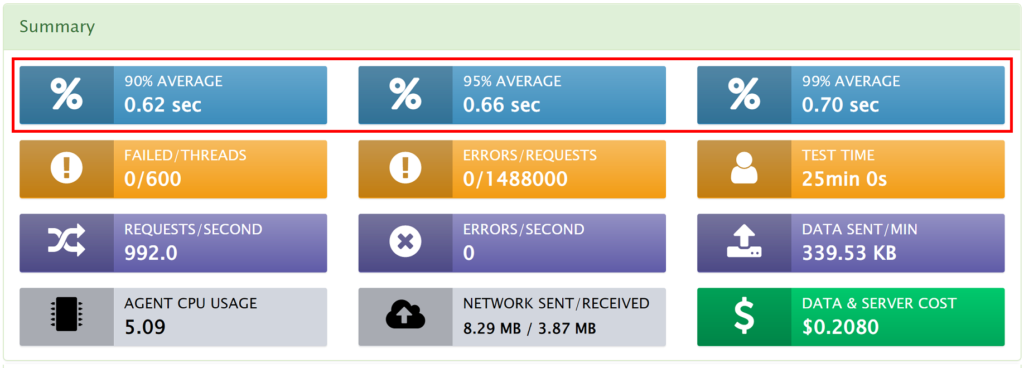
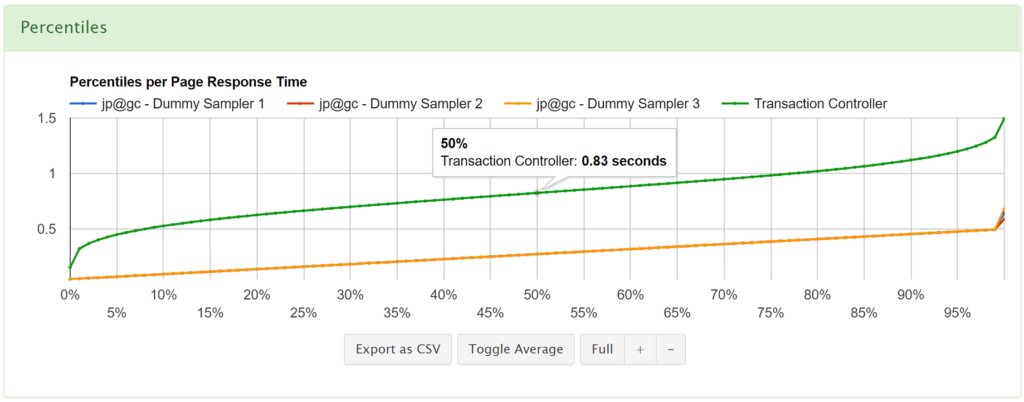
By default, we display the 90th, 95th, and 99th percentiles in the summary section, however we additionally graph all percentiles at the request level. To visualize those percentiles, you can hover over the desired metric. For example, below we are viewing the 50th percentile for a “Transaction Controller” within a JMeter test:
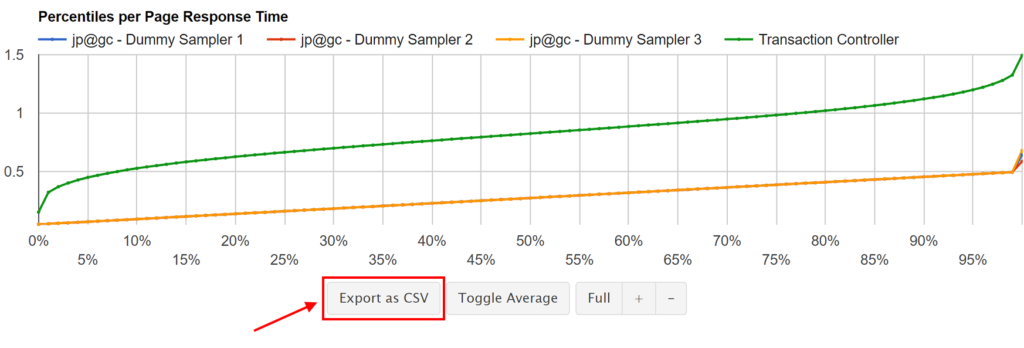
If your analysis requires the raw response time percentiles data, this graph also has an “Export to CSV” option that will enable you to download percentiles in this format. From there you can open the data in any spreadsheet application (such as Microsoft Excel) and analyze the data any way you wish.
Viewing Percentiles within the JMeter Dashboard Report
The second place that we make response time percentiles information available to you is within the JMeter Dashboard Report. Obviously, this only applies to JMeter tests. When the “Save Response Output and Calculate Percentiles” option is enabled as described above, the JMeter Dashboard Report will appear under the “Output Files” section. From there you will have the option to view the report in your browser, or download the report as a self-contained archive.

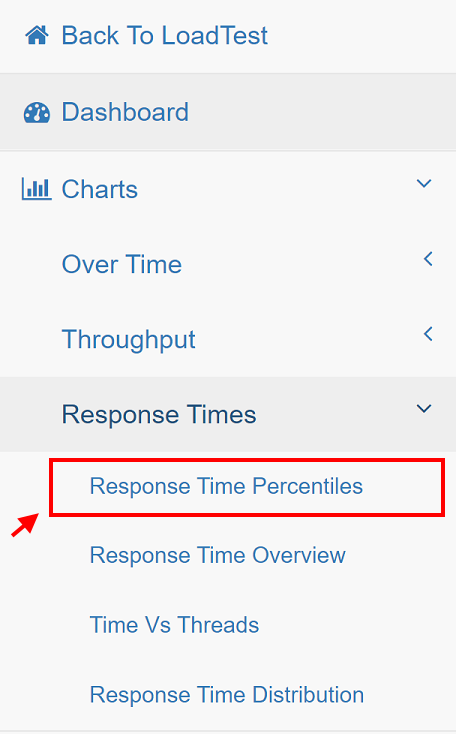
From with the JMeter Dashboard Report menu found on the left-hand side of the screen, select “Response Time Percentiles“:
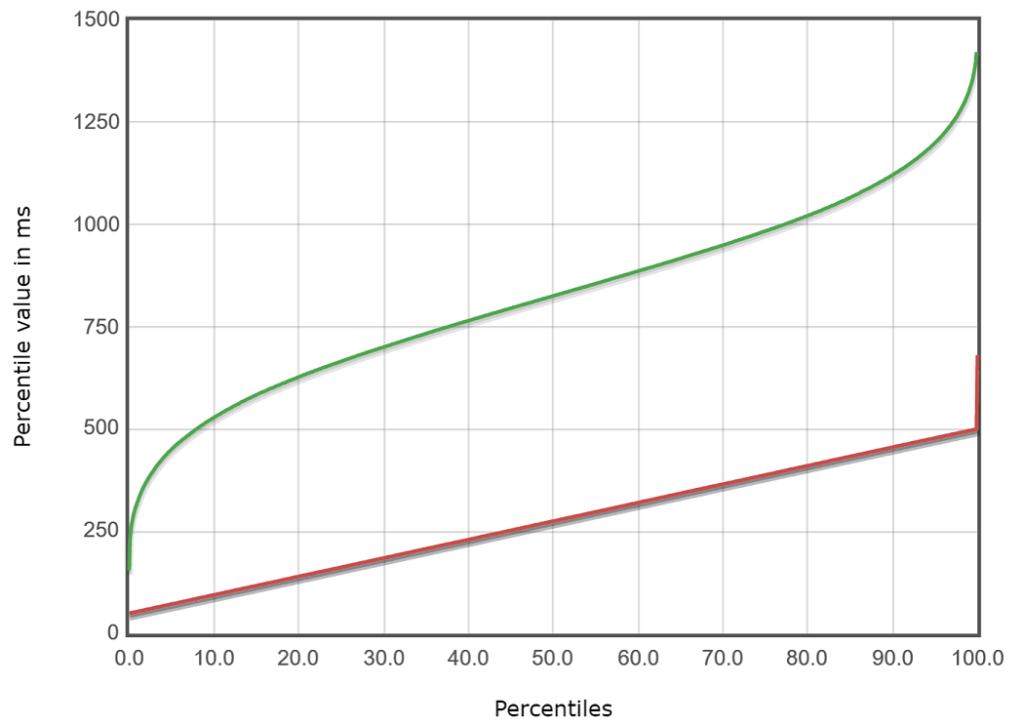
This will display up an interactive and zoomable percentiles graph which offers flexibility in presenting response time percentiles data:
In addition, there are several other tabulated and graphical displays for percentiles data, including “Response Time Overview“, “Time vs. Threads“, and “Response Time Distribution“.
