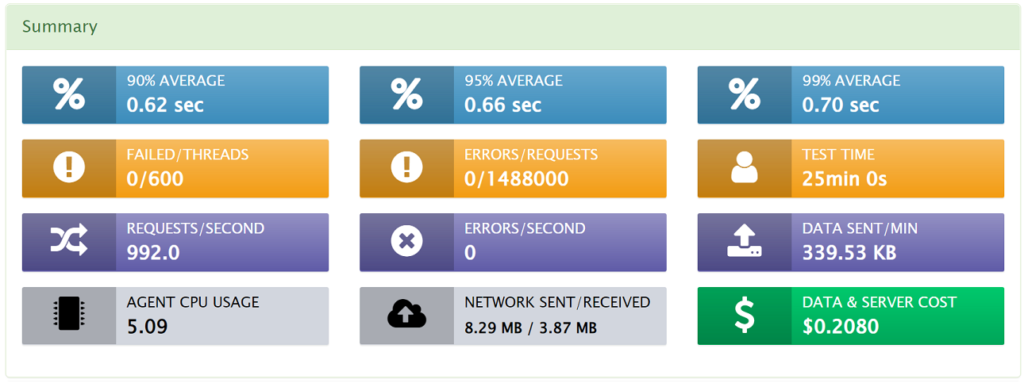
At the top of every completed load test, is the test “Summary“. This area provides an at-a-glance view of the most pertinent information concerning the overall performance of your load test.

Each of these blocks and the data they display is summarized in the table below.
Summary Block Descriptions
| Block | Description |
| Percentiles | The top row of blocks (blue in color) appears only when the calculation of percentiles has been enabled. |
| Failed/Threads | This split field contains two metrics. The first number contains the number of failed threads. The second number contains the total number of threads. |
| Errors/Requests | This split field contains two metrics. The first number is the number of requests with errors encountered throughout the duration of the test. The second number contains the total number of requests. |
| Test Time | The total duration of the test. |
| Requests/Time | This field is a calculated metric which gives an average request rate over the entire duration of the load test. |
| Errors/Time | This calculated metric gives an average error rate over the entire duration of the load test. |
| Data Sent/Time | This calculated metric gives an average data transmission rate (outgoing) taken over the entire duration of the load test. |
| Agent CPU Usage | This is a simple average of CPU usage over the entire duration of the load test. |
| Network Sent/Received | This split field contains two metrics. The first is the total data sent by all load generators for this test. The second is the total data received by all load generators for this test. |
| Data & Server Cost | This is an estimated cost for the load test which takes into account AWS EC2 costs for load agents, as well as AWS data transmission costs from those instances. We apply a worst-case algorithm to this number, and often the real costs billed are significantly lower. |
