While Apache Jmeter is packed with features and is extremely powerful, this popular testing tool can be a little daunting at times for first-time user that want to optimize their test plans. In this article we are going to take a look at 8 useful tips for optimizing JMeter tests plans which in turn help you become a more efficient tester.
Don’t run Production Load Tests in GUI Mode
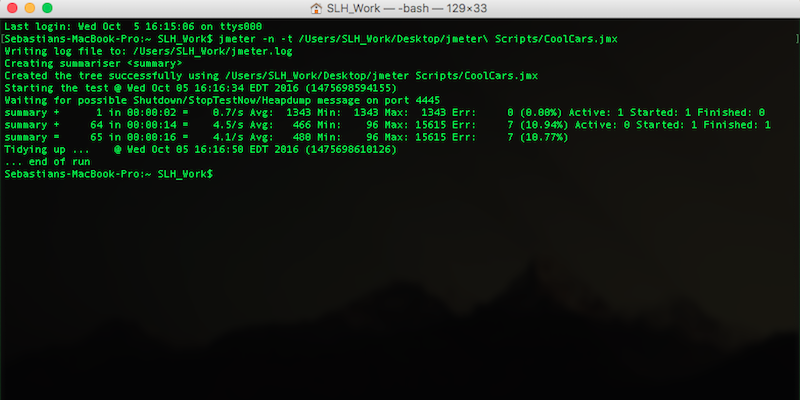
- While it’s okay to run small tests and to debug your scripts in GUI mode, it’s best to use JMeter in non-GUI mode for production load tests. GUI mode consumes a lot of memory and other resources, which in turn negatively impacts your scripts and tests. Using the non-GUI mode of JMeter helps to reduce both resource requirements and potential errors. To execute JMeter tests in non-GUI mode, you can run them from your terminal with the following command: jmeter -n -t /location of scrip/NameOfYourScript.jmx
- (-n): tells JMeter to run in Non-GUI mode
- (-t): name of .JMX with test plan
- (-l): name of JTL file for results
- (-j): Jmeter run log file
Always use Response Assertions for Every Request
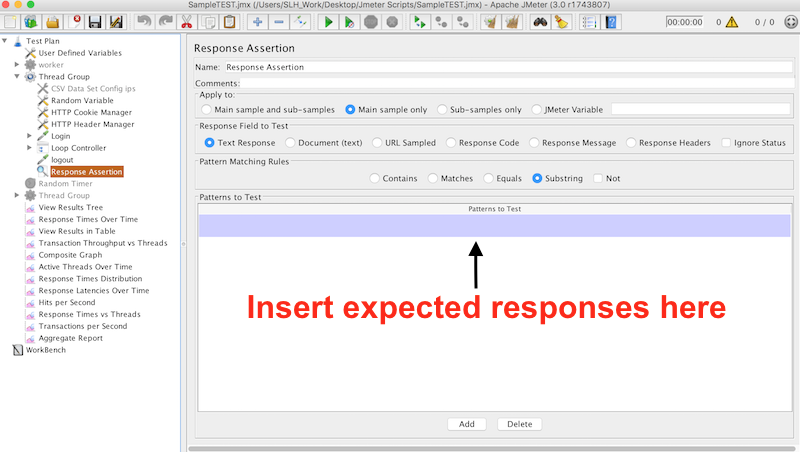
- Response assertions are very important for optimizing your JMeter test plans. First, response assertions allow us to be sure that our results are exactly what we expected them to be, as we use response assertions to omit certain responses. If we don’t use response assertions, our error page will be absolutely packed with errors and response assertions can be used to reduce the size of the error list. So be sure to input your expected responses to streamline your script.
Double Check your Thread & Thread Group Count
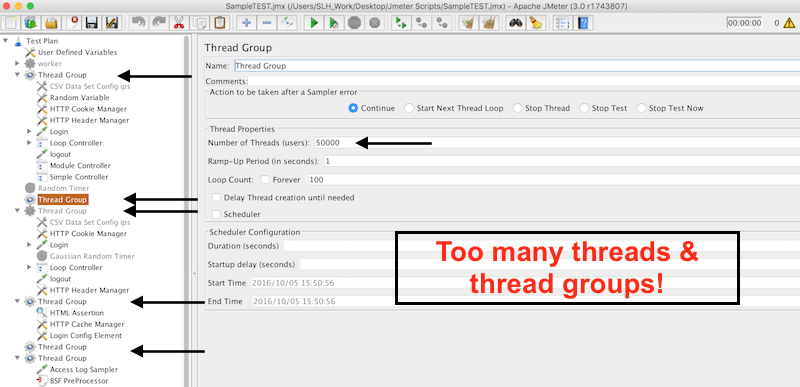
- Thread groups are essentially a combination of various test plan elements and we can have multiple threads in any given test plan. The thread count is the number of threads that are going to be executed by the test plan and it’s important to ensure that you have the correct amount of threads for any given JMeter test; too many and you’ll start to face resource issues. When you’re testing locally before scaling, it’s important to take your computer’s hardware into consideration. Too many threads, and your test plan will not run optimally (this is why we scale on the cloud!). So, be sure to double check your thread count and omit any threads that you may not need.
Use Timers Correctly
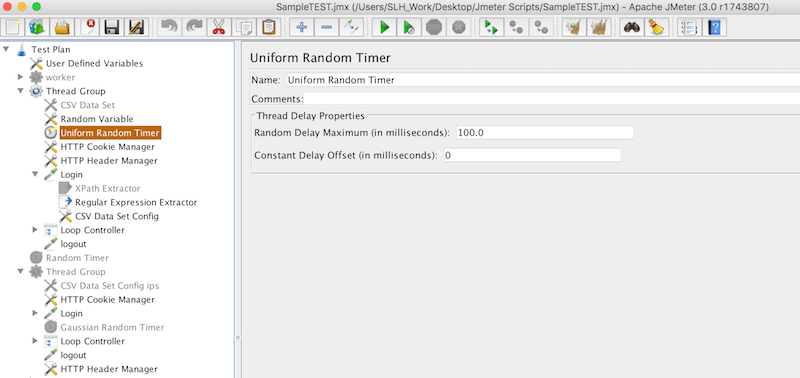
- Timers are a necessity when we want to simulate realistic load tests, however they can easily be used incorrectly and it’s one of the most common mistakes new testers make. If you’re new to scripting in JMeter and load testing, be sure to pay extra attention to your timers as timers apply to the entire scope of where they are placed, meaning they may impact more than one parameter of your JMeter script.
Incorporate Module & Simple Controllers to Reuse Code
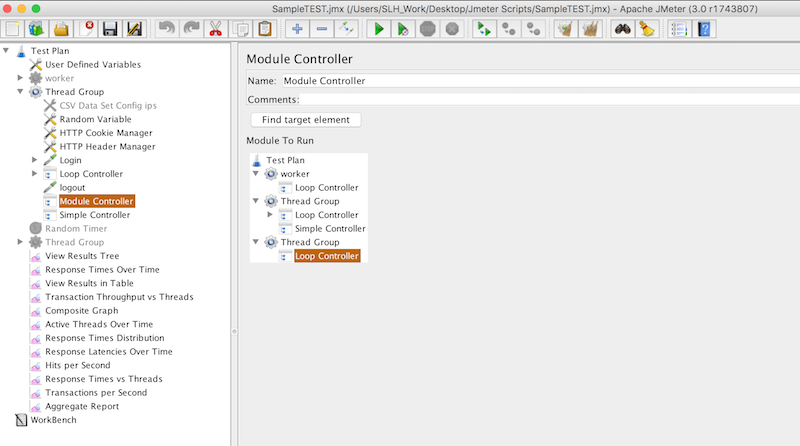
- The module controller and simple controllers are tools within JMeter that are often overlooked and they can make a big difference. Load testing often involves using the same code over and over again, for example like when you’re testing login or a homepage. So rather than having to type out your code each and every time, you can use the module controller to reuse your code as needed. To add a module or simple controller, navigate to your respective thread group and right click, hit “add” -> “Logic Controller” -> “Module Controller” or “Simple Controller”. You can now find target elements and select which specific modules you want to run.
Be Realistic with your Simulations
- It’s also important that we remember to stay realistic with our simulations. Say we are testing a login for an application and you expect 5,000 daily users from normal traffic, for example. It doesn’t make a whole lot of sense to simulate 5,000 users logging in simultaneously over the course of 5 seconds, rather, we should add some timers so the logins are spaced out in a more realistic manner. Or, let’s say you’re testing a database. It doesn’t really make sense to use small t2.micro’s as your instances, because you probably will not be hosting on such a small server. Hone in on exactly what you want to test and nothing more and add in your respective correlations, variables, timers, and assertions to make your test as realistic as possible.
Consider Groovy for Scripting
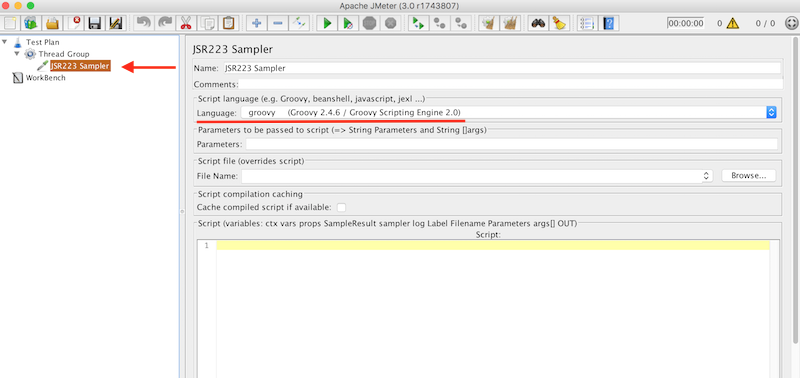
- Another great tip for JMeter is using Groovy as your scripting language. Groovy integration has improved in JMeter 3.0+ and it’s a language that’s integrated with Java, so it can also support any code written in Java. Because Java is integrated with Groovy, your tests are less verbose, more streamlined, and elements are more clearly expressed. Groovy is a great dynamic scripting language that is well-maintained, offers support for a compilable interface, and it outperforms virtually all other languages in JMeter, primarily BeanShell. You can select Groovy as your language by adding a “JSR223 Sampler” to your thread group and then select “Groovy” under the “Script Language” settings.
Generate your reports after the test has completed
- Another common mistake that you can avoid has to do with reporting. It’s important to generate your reports after your test has completed to ensure that your results are accurate. If you generate your reports during your load test, your reports will be inaccurate as they are incomplete. So just be patient, and generate your reports once your test has ended.
With RedLine13, you can run a JMeter Load Test with your JMX script of any mobile application, web application, or API.
