The Selenium+JMeter plugin was built for QA teams to support functional and performance testing from the same test plan. Our plugin captures Selenium test playback which can then be downloaded as a standard JMeter .jmx file. This can be uploaded back into JMeter or run via a cloud test using RedLine13 or other cloud load testing providers. To help you get started, we will take a brief look at how to setup and use our Firefox plugin.
Installation
- Begin by downloading and installing the Selenium-IDE Firefox plugin in your browser.
- Next, download and install the RedLine13 Selenium + JMeter plugin for Firefox
- Restart your Firefox browser
- You should now notice that there’s a new Selenium icon found with Firefox’s toolbar:
 ‘
‘
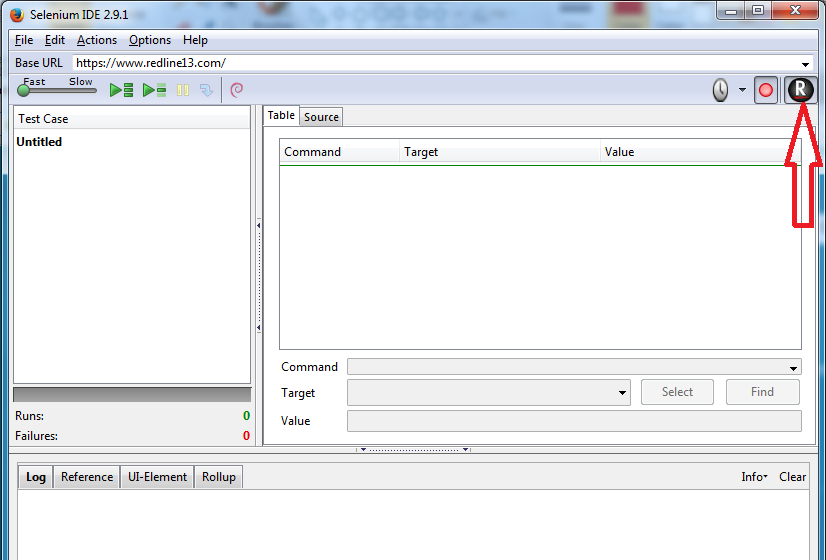
- Click on the Selenium-IDE icon, it will launch the Selenium-IDE window. If you see the RedLine13 icon found within the Selenium-IDE window, you have successfully installed the plugin:
Now, let’s take a look at our newly installed plugin and review the various options:
- Begin by going to Firefox -> “Add-ons” -> search for “Jmeter” in “My add-ons”
- Click on “options”
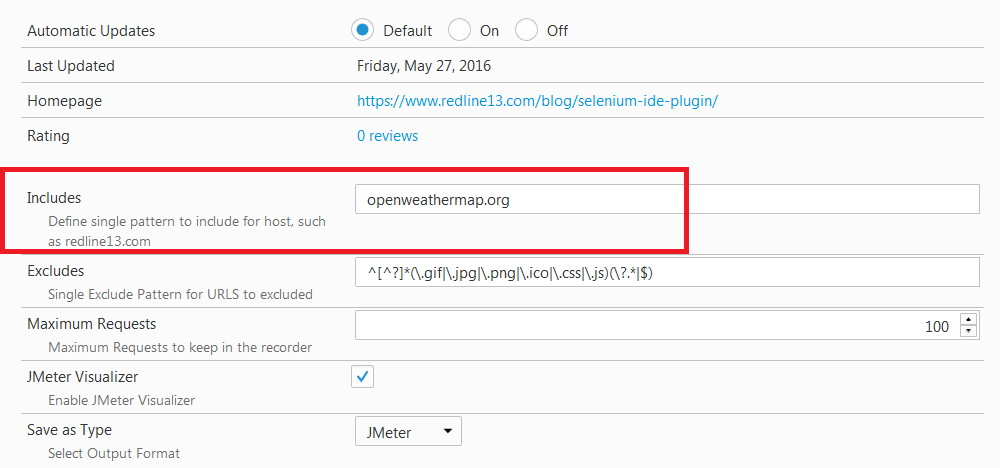
- You will then see the following available options:
- Includes: limit sites which get recorded
- Excludes: excludes patterns from being recorded (for example, images)
- Maximum Requests: limit number of requests recorded
- Visualizer: enable JMeter visualizer
- For most cases it’s best to use the default options except the “includes” parameter
- Next, specify the website URL which you would like to load test. This website will then be recorded and a JMeter script will be generated for your convenience
Script Recording:
For script recording with the RedLine13 Firefox plugin:
- Open the Selenium-IDE window by clicking on the Selenium icon on the toolbar
- Next, click on the RedLine13 icon within the Selenium-IDE window to begin JMeter Recording
- Open your application within Firefox
- Begin to play your web application as per your defined load tests scenarios/parameters
- When the test has completed, click again on the RedLine13 icon within the Selenium window
- When prompted, save the generated .jmx file
- Note: It’s important to save the generated .jmx files when it prompts you to do so otherwise, you will lose your recorded scenario and will have to repeat and re-run your test again.
Open Generated Script:
- Begin by opening JMeter and your saved .jmx file
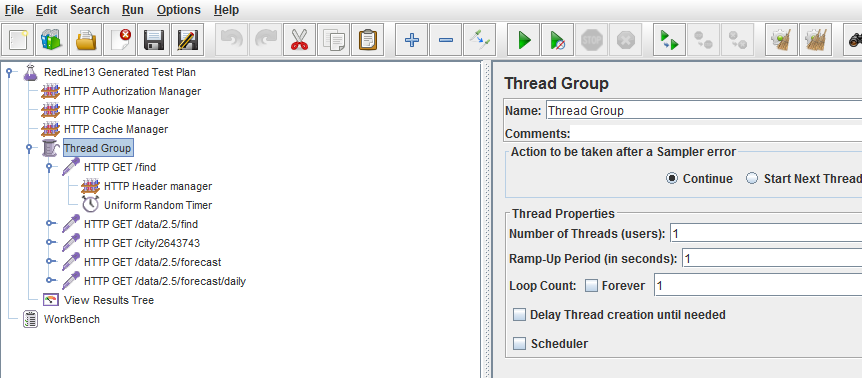
- You will now find that there are a few elements that have been added by default to your test plan
- HTTP Authorization Manager
- HTTP Cookie Manager
- HTTP Cache Manager
- HTTP Samplers
- View Results Tree
- Each recorded HTTP samplers will have “uniform random timer” added to simulate your “think time”

Important Points to Consider:
- The generated script may have some additional or unwanted sampler recorded. To ensure accuracy, it’s nest to review the generated script and remove any and all unwanted samplers to make the script clean.
- Review all dynamic values in the generated script and correlate dynamic values with the help of regular expressions. For more information, review this blog post.
- All parameters will be hardcoded in the generated script, so it’s important to review all parameters that require parameterization.


1 Comment
Comments are closed.