A run down of all the data available during and at end of a test plan.
- Downloading Raw Data
- Aggregated Graphs
- Request Graphs
- Agent Specific Graphs
Downloading Raw Data
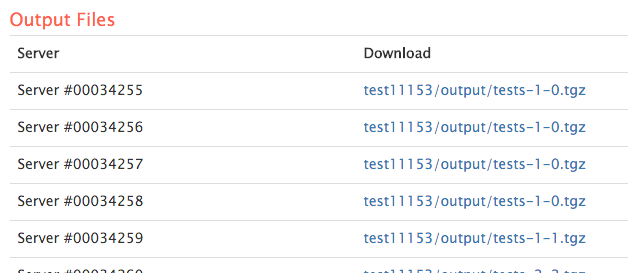
Before we dive into the displayed graphs, in ‘Pro’ you can access your raw data and information by selecting “Save the response output from individual tests and calculate percentiles”. These results will be available at the end of the test run are separated by test server.
- Simple and Custom: the individual results from each request
- JMeter: jtl (csv format) & log for each test server with all individual results
- Gatling: log file with individual results
Aggregated Graphs
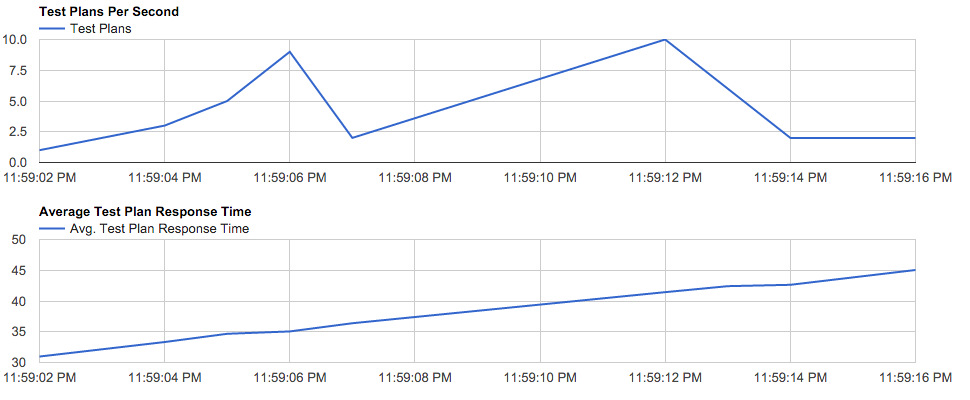
The first two graphs are aggregated across all servers and endpoints which metrics are gathered for.
- New Requests Per Second: This is the number of users (Simple&Custom) or threads/users(JMeter&Gatling) completed at that point of time.
- Average response time: Time to complete test plans / number of test plans reporting complete at that point in time.
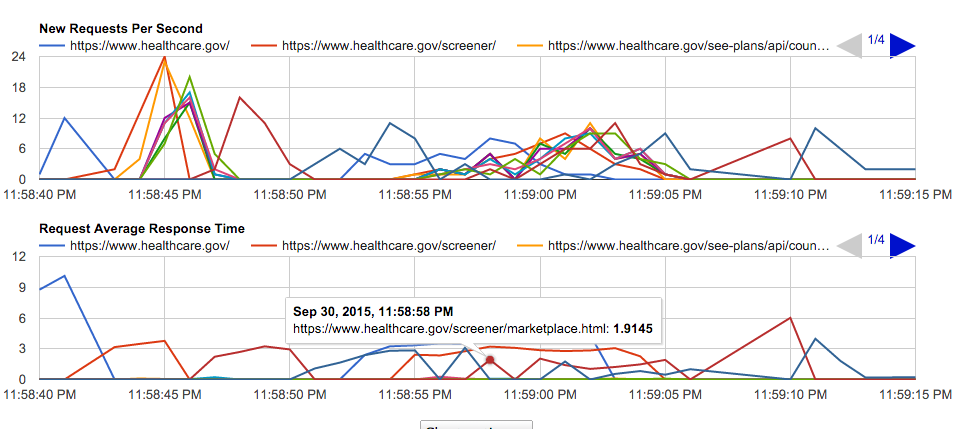
Request Graphs
- Requests Per Second per end point: Number of requests completed for specific end point at time
- Average Response Time per end point: Time to complete end point / number of requests completed for end point at timestamp.
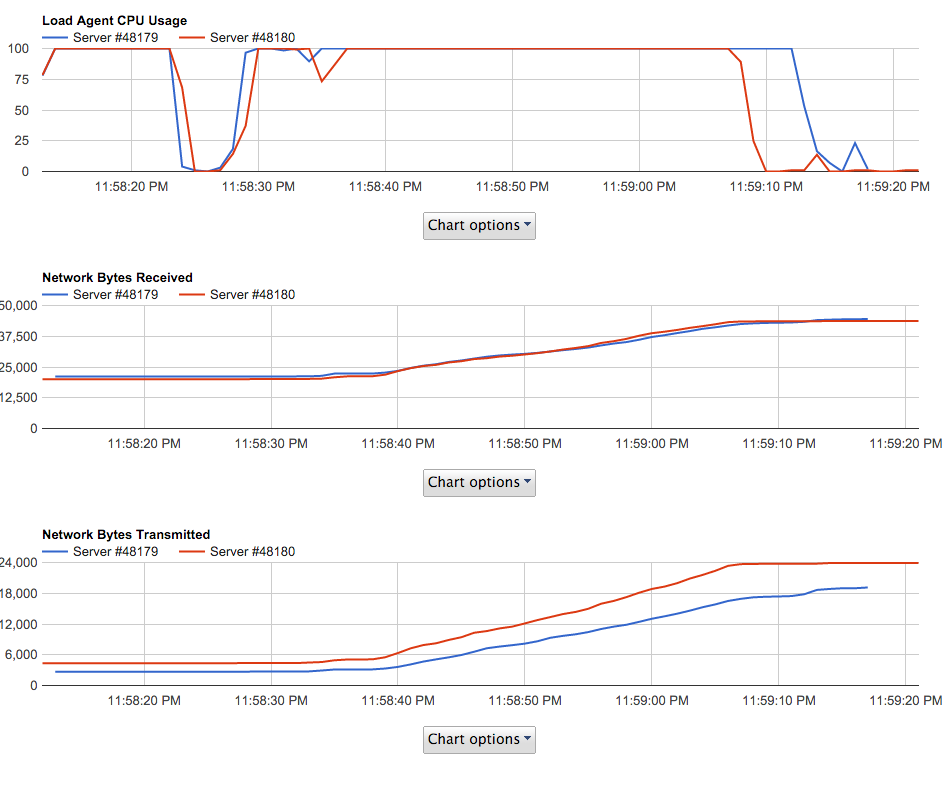
Agent Specific Graphs
- Agent CPU during test: CPU Usage helping to detect if an agent is overloaded during the test
- Network Bytes Received: Bytes received cumulative during test
- Network Bytes Transmitted: Bytes sent cumulative during test
Percentage Graphs
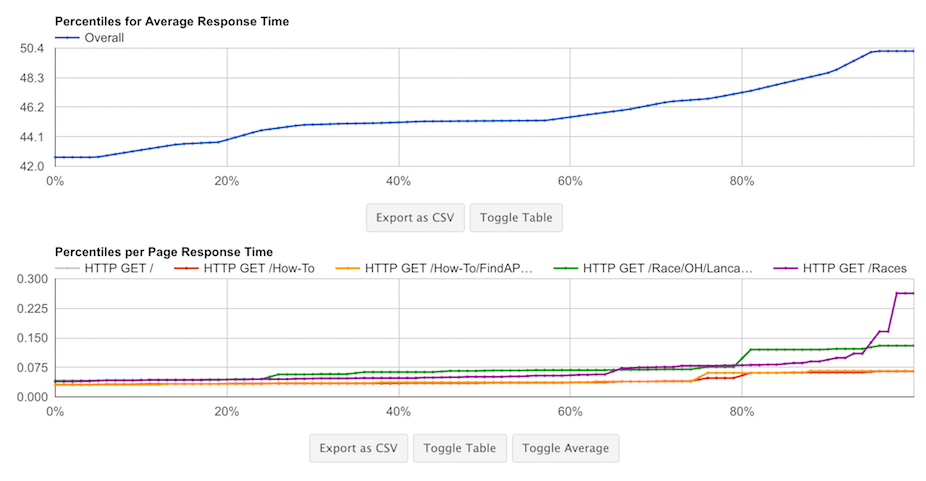
For our purposes, the percentile represents the percentage of pages that responded at or faster than a specific time
- Percentiles for Average Response Time: The average number of tests that responded back at each percentile
- Percentiles per Page Response Time: The percentage of tests that responded back for each specific request for various time periods
