With any JMeter test, thread groups constitute the basic container for test plan requests and other elements. The simplicity of the basic thread group is such that with enough ingenuity anything is possible. Through clever use of scripting, timing, and logic elements it is possible to simulate any user behavior. However, for simulating complex traffic patterns there is an easier way.
One of the most useful plugins for JMeter comes as the “Custom Thread Groups” collection. These are available for installation right inside JMeter through the “JMeter Plugin Manager” via JMeter-Plugins.org.
Setting up Custom Thread Groups in JMeter
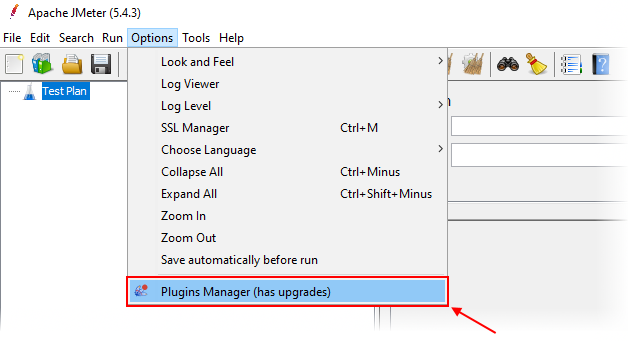
The first step is to install the “Custom Thread Groups” collection within JMeter. This will make available the collection of plugins discussed in this post. To add these, select the “Plugins Manager” from the “Options” menu:
Inside the “Plugins Manager”, navigate to the “Available Plugins” tab and search for “custom”. Select “Custom Thread Groups” from the list at the left, and then click “Apply Changes and Restart JMeter”.
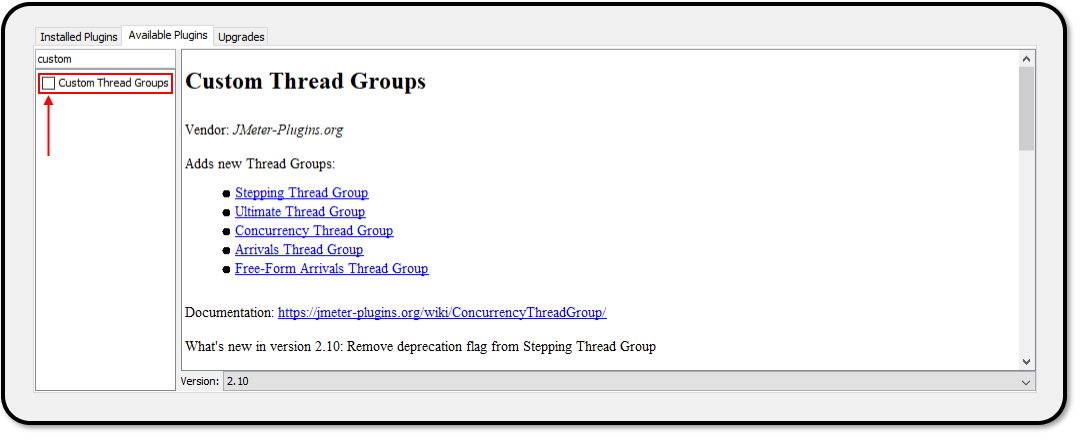
Once JMeter has restarted, these new thread groups will be available for use. We will detail below how to set up two popular thread groups from the “Custom Thread Groups” collection.
Using the Stepping Thread Group
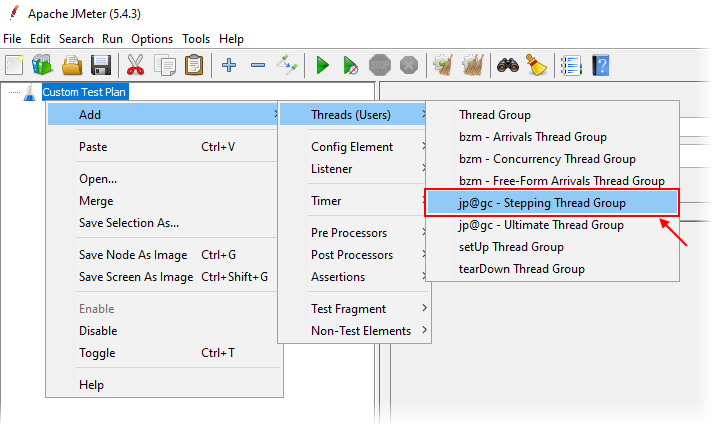
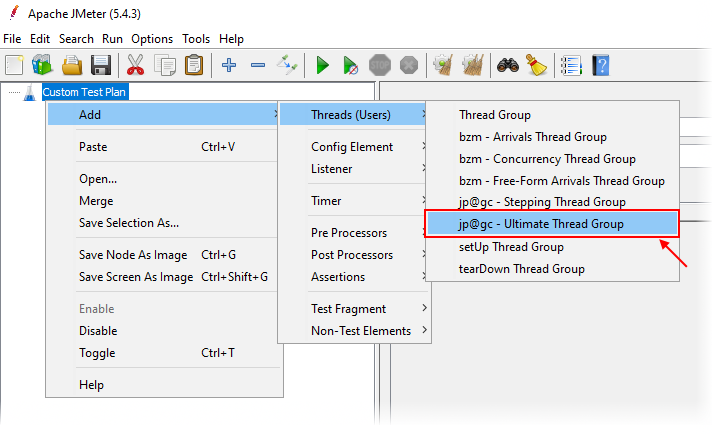
After installing the plugin group, you can add a “Stepping Thread Group” to your test plan similar to adding a normal thread group. Simply right click on the root test plan and follow the menus as shown below:
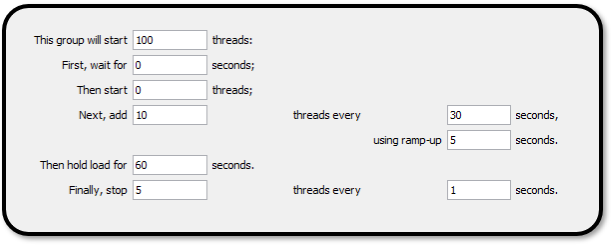
The default options that are set up for a new “Stepping Thread Group” do a good job at explaining the capabilities of this thread controller. In the example below, there are 100 threads total configured to start in discrete increments (i.e., steps) at regularly spaced intervals.

The graphical representation makes this easy to understand. Here ten threads are added every 30 seconds until the maximum number of threads is reached. This can be used to approximate a real-world scenario where there is a gradual ramp up of concurrent users over time. Of course we could also achieve this with timers and scripting, but the Stepping Thread Group makes configuring this simple. It is also very easy to change the configuration for more users and different stepping rates by changing a few parameters on the configuration page:
Using the Ultimate Thread Group
True to its name, the “Ultimate Thread Group” gives ultimate flexibility and control when designing a load test that follows a predetermined load profile. In the example below, you can see a steady-state with a gradual ramp up and ramp down. Additionally we have configured two “spikes” in the middle of the test. This is to simulate momentary increases in users to a site on top of steady baseline traffic. Looking at the graph it is easy to understand what our test is doing at any given point:

It would be difficult to achieve this or potentially more complex load profiles with ordinary thread groups. With the Ultimate Thread Group it is simply a matter of specifying a few metrics. Here is the configuration for the above load profile:

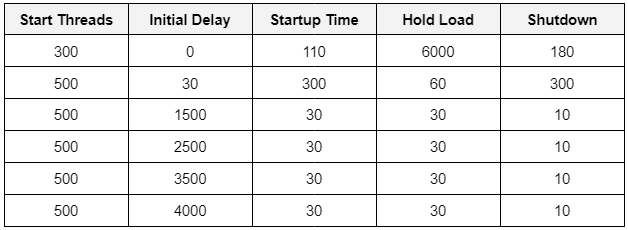
With some simple variation of the thread schedule parameters, we can easily describe another scenario. Suppose we wanted to simulate a large 800 concurrent user surge, followed by intermittent high-load spikes on top of a 300 concurrent user baseline. The graph would look something like this:

Surprisingly our thread schedule configuration is not significantly more complicated than our previous example. Even though the request profile appears radically different, it is easily described with the following numbers:
Simulating Complex User Behavior
Each custom thread group we have described can be used to emulate a specific user request profile within your load test. Building upon this, we can mix and match different thread groups to simulate even the most complex traffic patterns with ease. Furthermore, instead of dedicating test logic to profiling requests, we can use scripting to vary between active thread groups within our test. We can also incorporate other test elements into a custom thread group such as CSV Data Set Config elements to simulate real-world data-driven scenarios.
Be sure to check out our YouTube Channel for our video guides on JMeter topics. In particular, we review how to set up and run a JMeter test with shaped request profiling, both locally and on RedLine13.
Did you know that RedLine13 offers a full-featured free trial? Sign up now and start testing today!

