Dynatrace is a leader in application monitoring, the process of measuring application performance, availability and user experience. Dynatrace has many integrations. This article will focus on the Dynatrace integration with JMeter and how that can add an additional dimension of analysis to your load tests.
Why use Dynatrace when load testing?
While load testing tools provides a wealth of information at the network level, sometimes it is desirable to analyze what is going on at the application level. Sometimes this is possible by reviewing logs or performance on the target application servers. However, it would be even more useful if there were a way automatically to link these application metrics to the actual load test results. Furthermore, it would be ideal if we could correlate test-specific and even request-level metrics from our load tests with application performance. This is exactly what is made possible by APM tools such as Dynatrace when integrated with JMeter, which is the most popular load testing tool for analyzing and measuring the performance of a variety of services. We will also use RedLine13 as our platform to scale our JMeter load tests.
Setting up Dynatrace
As a prerequisite, a Dynatrace account is required. If you do not already have an account, you can sign up for a free trial on the Dynatrace website.
After you have your account set up, you’ll want to install the Dynatrace agent on any of your application servers that you want to monitor. This lightweight service will send telemetry information back to Dynatrace to be logged in your account. We’ll be showing you how to customize that telemetry as part of this post. Once the Dynatrace agent is installed on your application servers, you can customize your load test to take advantage of advanced APM features.
Dynatrace Integration with JMeter
If we want our test to take advantage of some of the more useful features of Dynatrace, we’ll need to add a few things to our JMeter test. For this example, we want a way to tag load tests by their RedLine13 load test ID number, and have that be displayed back in Dynatrace. This will allow us to based on that as an associated metric.
RedLine13 exposes certain test-specific metrics to JMeter (such as the “Test ID” number) which can be pulled into tests via auto-generated parameters. You can also define your own custom JMeter properties and pass them in through RedLine13. Both of these topics are covered in this related blog post.
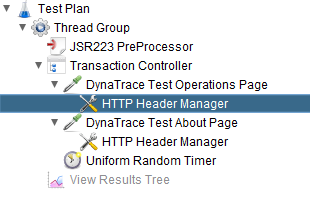
For our simplified integration, we will be utilizing “HTTP Header Manager” elements and attaching these to our web requests. The basic architecture of our test will look like this:

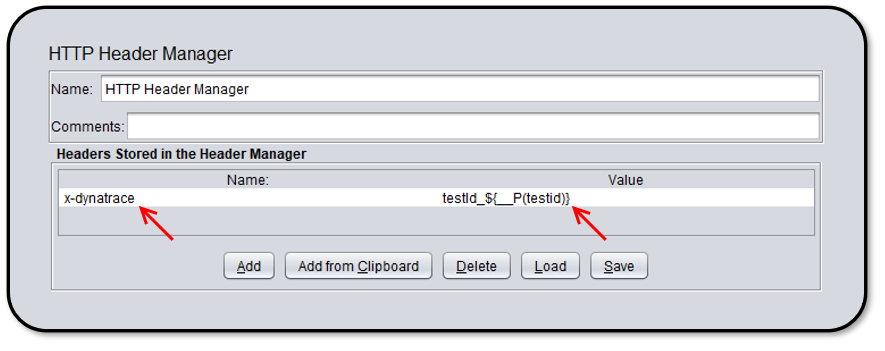
From there, we can configure each HTTP Header Manager element as follows:

In conjunction with the custom RedLine13 testId property that is automatically generated for each test run our our platform, JMeter’s built-in “__P()” function and ${…} notation represents by far the easiest way to to access our unique test ID number from our JMeter test. (Documentation on this built-in function can be found here.)
Capturing differentiated requests in Dynatrace
Dynatrace allows us to define custom “multidimensional” analysis data sources which can be captured and graphed. There are quite a few methods to accomplishing this, but we will be illustrating here how to define and use custom HTTP request headers. For detailed information on how to define custom data sources, you can refer to the official Dynatrace and JMeter integration documentation. However, to obtain basic integration on any x-dynatrace header, we can define:

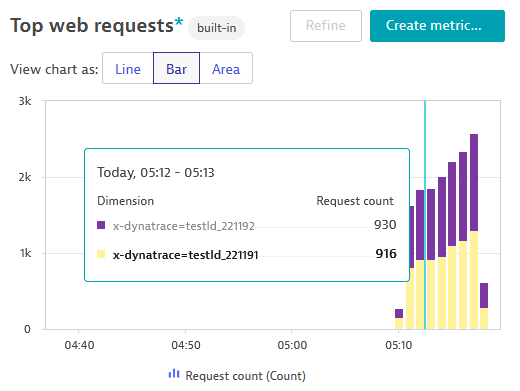
Once this is set up, when we run our JMeter test as configured above we can see that we have separation of unique data points on a per-test level basis. Using the advanced metrics filtering within Dynatrace, we can drill down and isolate data associated with specific tests run from RedLine13. Here is an example of that filtering applied to multiple concurrent test runs:

On the RedLine13 side, we can correlate information which represents the “client” side of the load test. Here is the summary as shown from within RedLine13 for this same test:

And here is a sample metrics graph showing requests transmitted:

Next steps
If you would like to reproduce the results described here, you can download the test used in this example to modify and try for yourself. The possibilities within Dynatrace are almost limitless. Dynatrace is highly configurable and allows for customization well beyond the scope of this blog post.
RedLine13 offers a fully-featured free trial. You can sign up and run your own tests with the Dynatrace integration with JMeter.

