
An important part of developing a performance test involves debugging of the test itself. Simply put, we must “test our test” to confirm that the results it generates are reliable. In this article we will walk you through how to troubleshoot your JMeter load tests. We will include some specific ways that RedLine13 makes this process easier for cloud-based load testing.
Common Mistakes
When creating a test plan, it is a good idea to be cognizant of common mistakes related to the design of the test. One of our industry partners The Test Tribe has a good article on Common mistakes in performance testing. These include consideration of adequate ‘think time’, pitfalls of inaccurate workload modeling, and considerations of infrastructure monitoring.
Local Debugging
As the test plan is built up, we will invariably run in locally at various stages of construction. We will want to catch simple mistakes such as URL typos, logical errors, etc., before we upload our test to the cloud with a service like RedLine13. While there are certainly additional methods and other tools available, we will describe a few common ways to debug your test plan locally.
View Results Tree
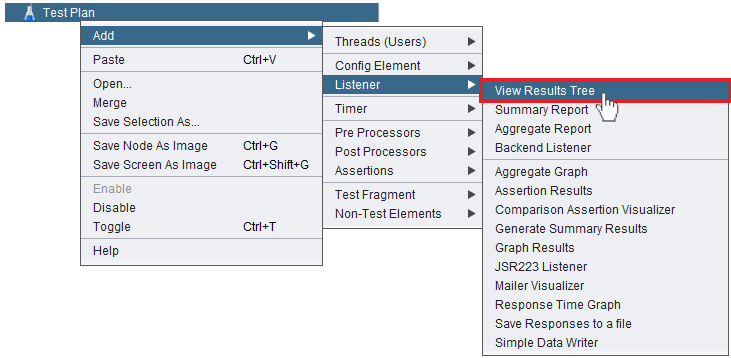
The easiest and most straightforward way to do this is to add a “View Results Tree” listener to your JMeter test. Having this element added to your test plan will provide you with real time results from each request generated. It can be found under the “Listener” submenu when adding a new test plan element:
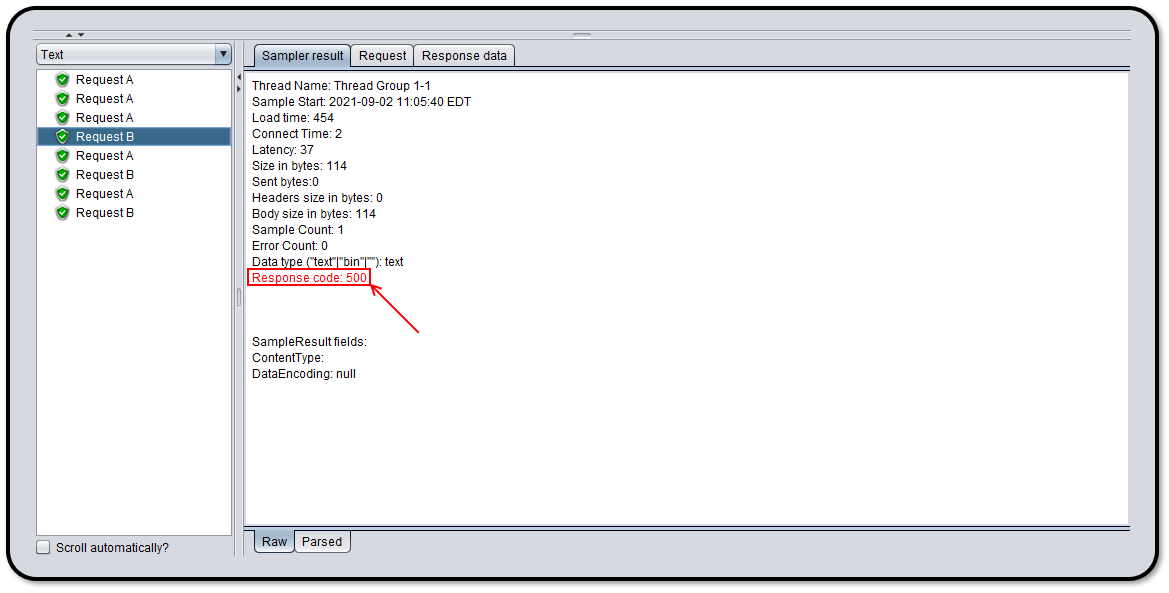
Here is some sample output for a very basic test plan. In this example, we can see that “Request B” is failing with a 500 Server Error:
It is far better to catch errors due to simple typos or settings misconfiguration when running locally. Though we could find this information after running our test in the cloud – which we will discuss momentarily – it can save vast amounts of time catching these early.
One thing we want to be careful of however, is that we remove any “View Results Tree” listener before we run our test for any actual data collection. Having one of these listeners specified can have detrimental performance effects for actual test runs.
JMeter Log Viewer
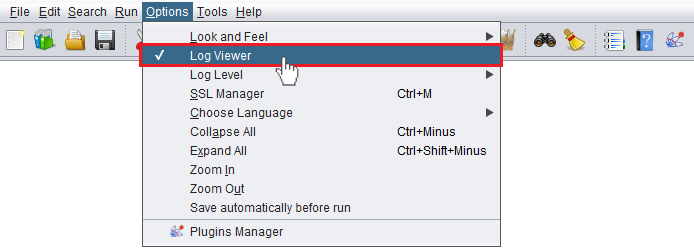
Another good option for debugging tests locally is using JMeter’s built-in “Log Viewer”. This can be displayed from the JMeter GUI from the “Options” menu as shown below:
In this example, we have captured an exception being thrown from a JSR223 post-processor:
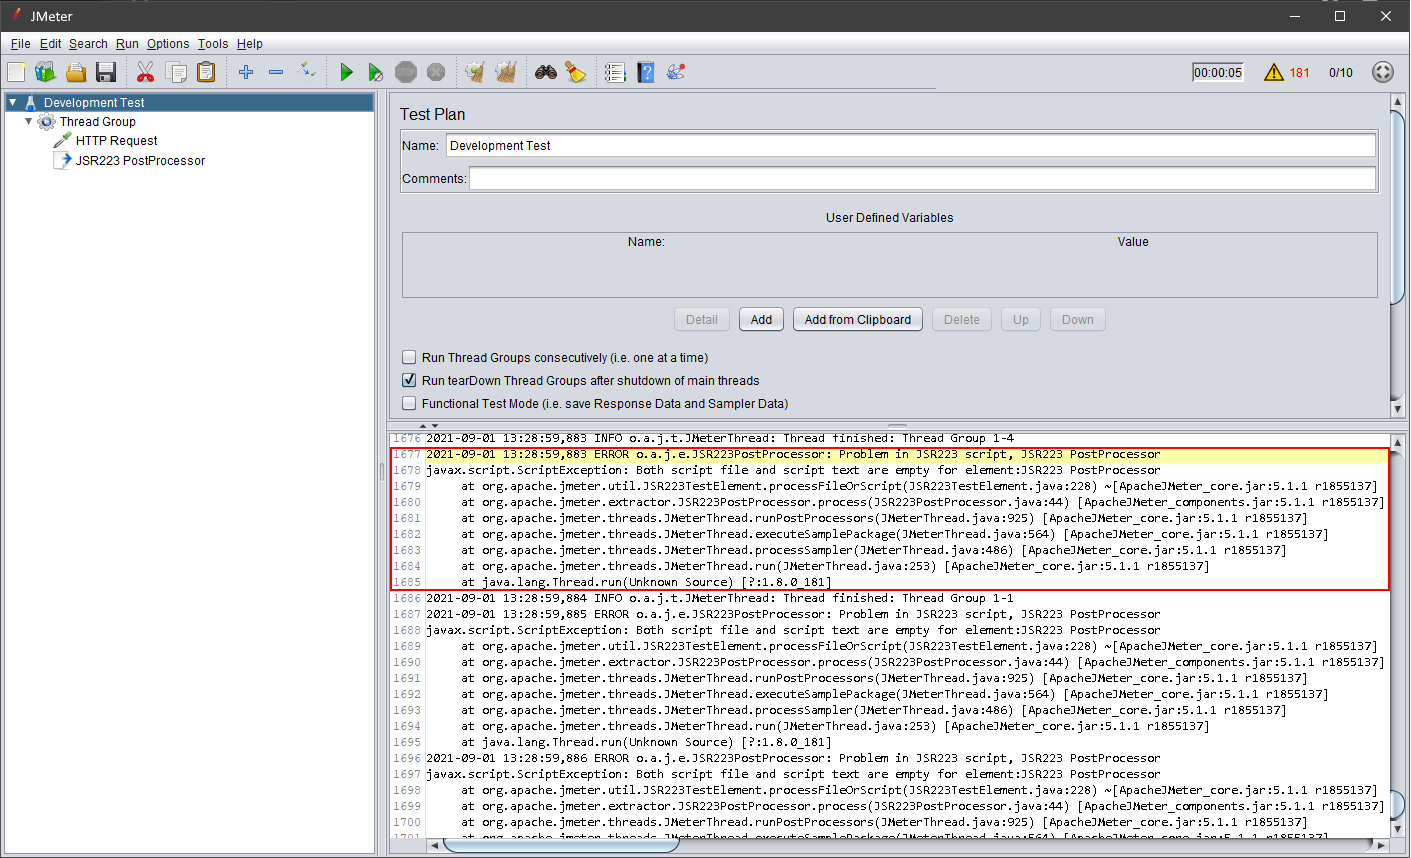
Not only will the log viewer record error responses, but often we will be presented with detailed additional information which may be useful in identifying and resolving potential issues with our test plan.
API Debugging Tools
While the JMeter log output will provide some level of detail, there are times when we need additional visibility to the actual web response before an issue is obvious. Two common desktop tools for debugging web and API calls are Postman and Telerik Fiddler. Here is an example of an API call and actual resultant output using Postman:

In this case we can see not only the specific response, but also the raw output from the server. If the problem is not obvious to us at this point, a next step might be to search for this request within the application server logs of the target system we are testing.
Forensic Debugging in the Cloud
Once we run our load tests in the cloud, we no longer have the luxury of real-time monitoring of our load tests though the JMeter GUI. For performance testing it is in fact highly desirable to run JMeter “headless” as to measure accurate performance characteristics of the system being tested. Having “View Results Tree” elements or real-time log outputs would be detrimental to load generator performance and run counter to our testing goals.
The Error Table
RedLine13 provides several ways for you to investigate problems with your load test. The most visible of these is the “Error Table” which is displayed at the bottom of the results page for every test. It even provides some near-real time output of the most frequent errors while a test is running. Here is an example of a test that generated multiple errors:
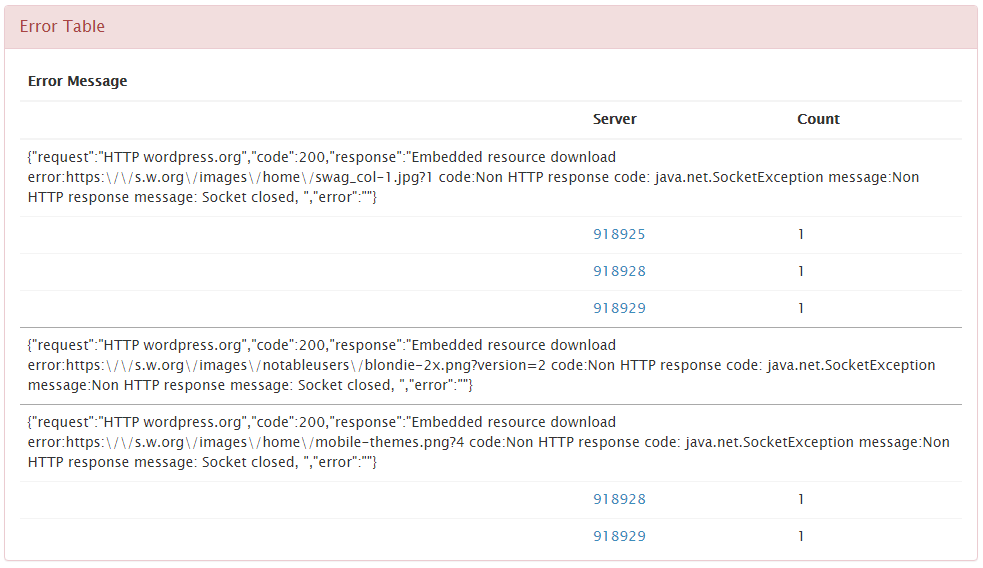
These errors normally would show in the log viewer if we were debugging our test locally. The “Error Table” that we display on our results page is designed to be a convenient window into some common errors which may be occurring – however, it should not be depended upon for a complete listing of all test errors.
Output Files
One of the best ways to debug a problematic load test is to directly view the JMeter log files. There is a feature built into RedLine13 that makes this task easy. In order to save your output and log files, you must check the “Save Response Output and Calculate Percentiles” option prior to running your load test:

This will provide you with the ability to download both JMeter output files as well as the raw log files for each load generator server. To download the files after the test completes, simply click on the compressed archive under “Output Files” for any listed load generator server:

Within this compressed archive, you will find several files:
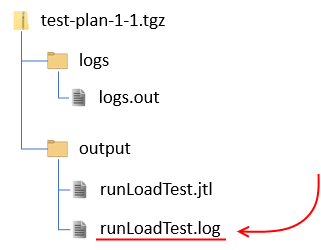
Under the “output” folder, there is a file named runLoadTest.log which will have the raw JMeter log output saved for your test. While this is often the most helpful file, the adjacent JTL file will contain useful response or failure information as well.
Free RedLine13 Trial Subscription
Did you know that RedLine13 offers a fully featured free trial subscription? Sign up today and discover the many benefits of load testing in the cloud with RedLine13.
