This is one of our most popular blog posts. We’ve updated it again with information you may not know about with real-time RedLine13 graphs.
RedLine13 graphs are aggregated from all load tests and can be viewed in real-time. What if you want to see specific time? It’s easy. Just select the time slice in the graph and see it immediately.

Check out some of the updates to graphs that we highlighted in the past.
After hearing some feedback from our users, we have updated our UI to improve the overall RedLine13 experience.
RedLine13 UI updates include:
- Improved graphs which are now aggregated from all load tests, and can be viewed in real-time
- Graphs are rendered when visible, speeding up initial page load
- The image output from WebDriver tests will load as they become visible on-screen
- Added a new loading animation for graphs

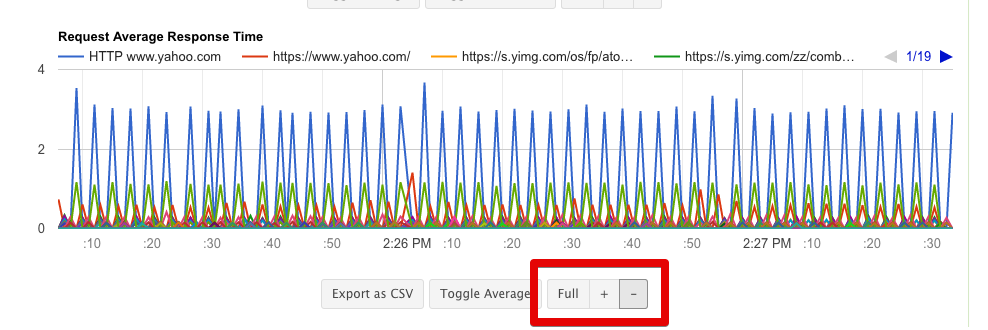
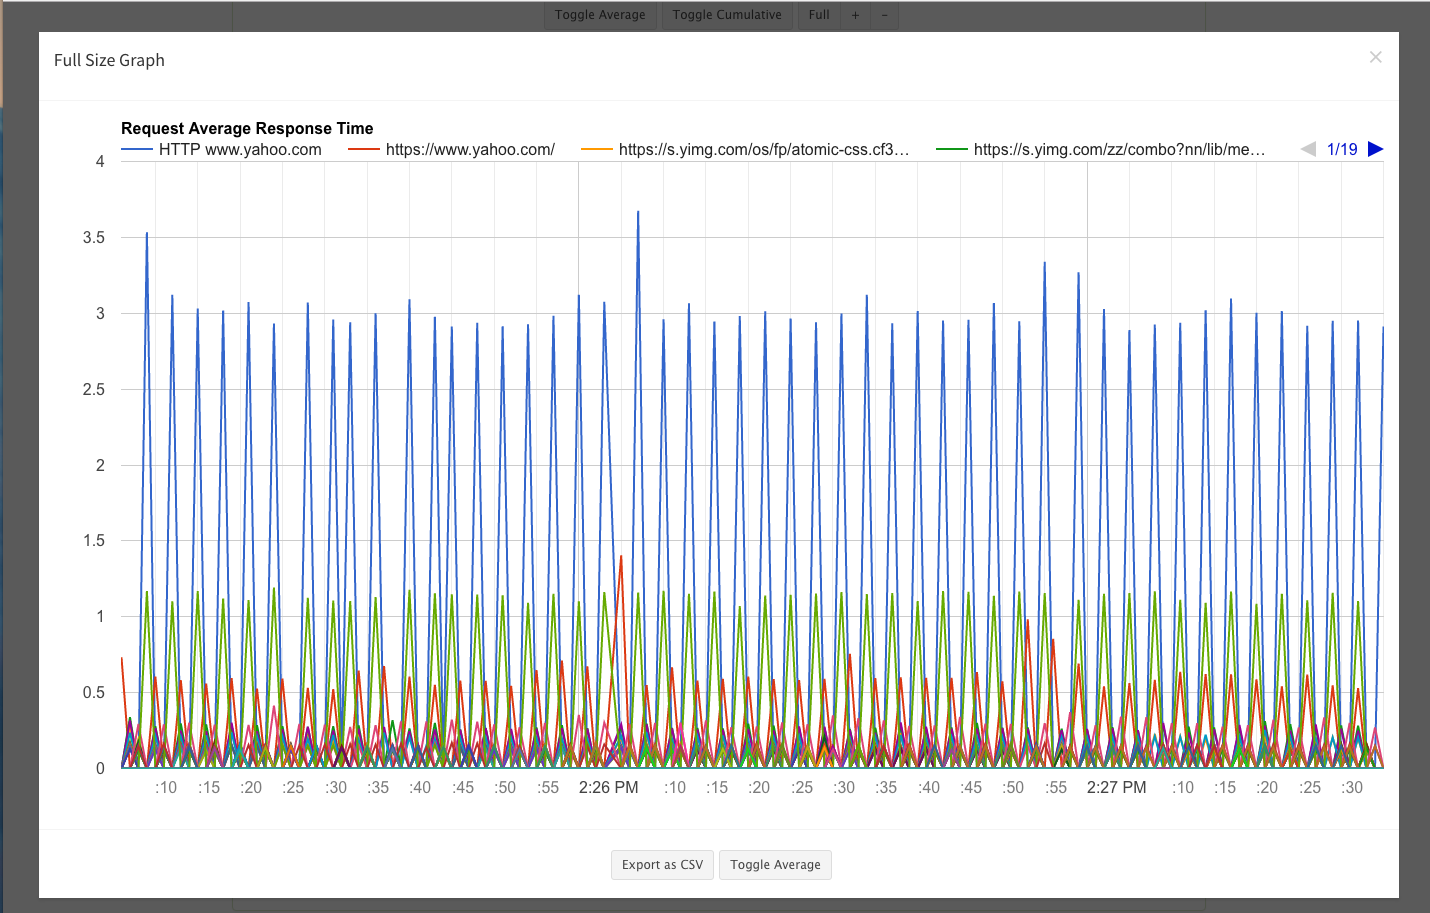
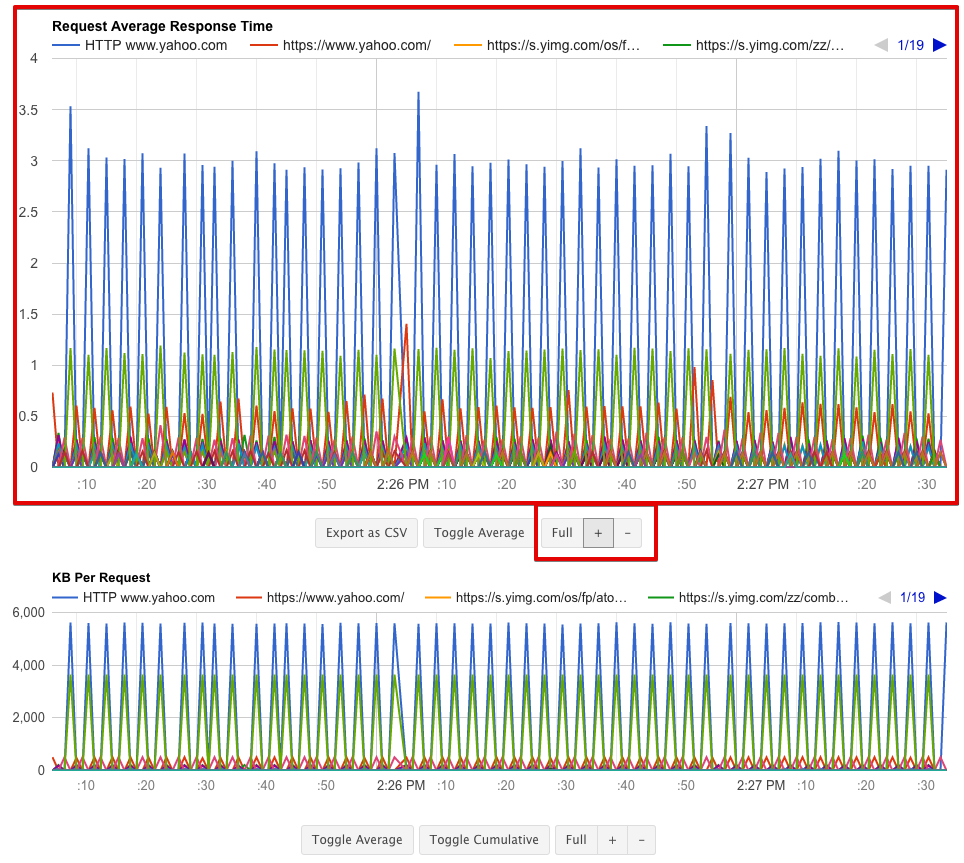
- You are now able to view a graph in full-screen in addition to being able to increase & decrease its size for your convenience

- You can now view the full-screen graphs and watch them run & update in real-time
- Added a new feature for paid subscribers to enable Page Requests to update live

- Graphs are now larger on page/inline view

- You can now zoom into a specific area within a graph to view it in greater detail (control-click will reset the graph view)

You can run your own test on RedLine13 for free. And see the RedLine13 graphs.
