Three new ways that life can be a little easier for JMeter Load Testers. We’ll start with the JMeter Dashboard Report.
JMeter Dashboard Report
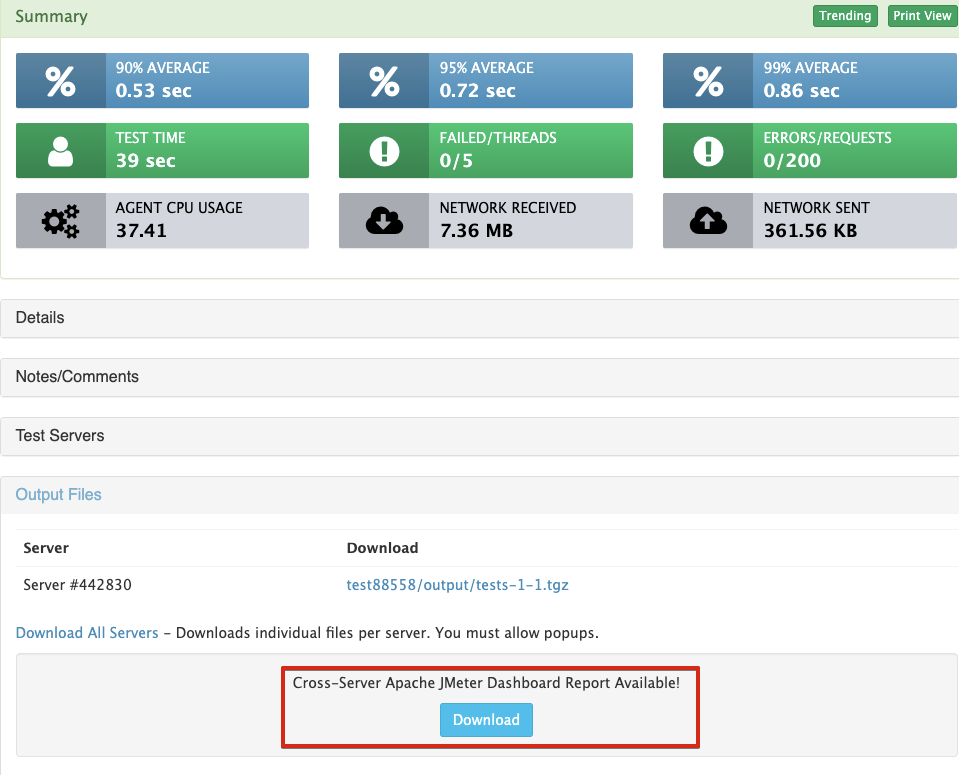
You’ve been able to generate the Apache JMeter Dashboard report for a long time yourself or with RedLine13. But you had to download it, then expand, then view.
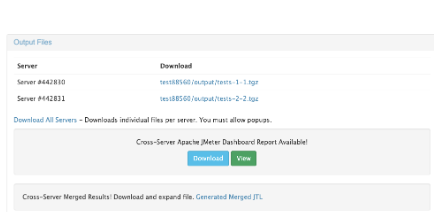
Now you can View it inline! So you get the RedLine13 generated reports and you also get access to the full JMeter report as well.

This is available for all tests – i.e. even if your run a Node.js test with Selenium you will get the JMeter dashboard report.

Once you view, you can click top-nav to get right back to RedLine13 test.
JMeter bandwidth plugin for Throttle tests
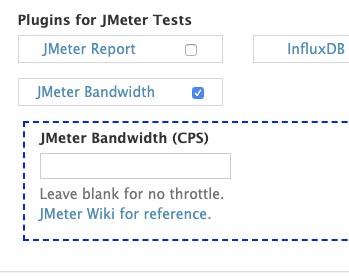
JMeter gives you the option to throttle outgoing bandwidth in order to simulate different network speeds. Note: this is a JMeter-only feature. RedLine13 now makes it easy and shows you the bandwidth choices.
Choices we show (from JMeter list):
This is a very simple plugin that you enable at the https://www.redline13.com/Account/plugins page. 
JMeter support for ALL test types
All test types now generate JTL files in RedLine13, like JMeter does.
1 – Every test can now generate a merged JTL
2 – Every test type can generate a JMeter Dashboard and graphs
3 – Every test type merged results can be downloaded and loaded into JMeter directly or any tool which supports JMeter to see the results.
This level of consistency in reporting makes all test types a bit more useful for JMeter users.
Run your own test on RedLine13 and try any of these cool new features.

