Typically, whether we are starting a load test or developing a strategy used for load testing, we often come to wonder about the specifics of the user’s usage patterns. “What exactly are users doing once they’re on our website?”, is a very common question that we often hear. Thankfully, web server access logs can help us answer this question and others due to the fact that these logs contain a range of information like HTTP requests, images, CSS, java scripts, and detailed session information, among other things. Even when patterns in traffic change, these access logs record everything from the individual changes to various shifts with general use.
RedLine13 recently launched Simple Apache & NGINX Log File Replay, but JMeter users already have this capability allowing them to create more robust performance test plans. The JMeter Access Log Sampler has been designed to not only read access logs, but to also generate HTTP requests as well which, in turn, simulates production traffic for our load tests. If you were to generate realistic loads and be able to profile applications and their bottlenecks, you will then be able to play this back on your live server logs on various test machines. Now access logs may not always entirely be useful, as is the case with those that have numerous forms and POST requests, however for websites that mainly utilize GETs, you are able to mimic live traffic with great detail.
(If you want to read more about the Access Log Sampler, refer to JMeter’s step-by-step guide and their component reference for Access Log Sampler)
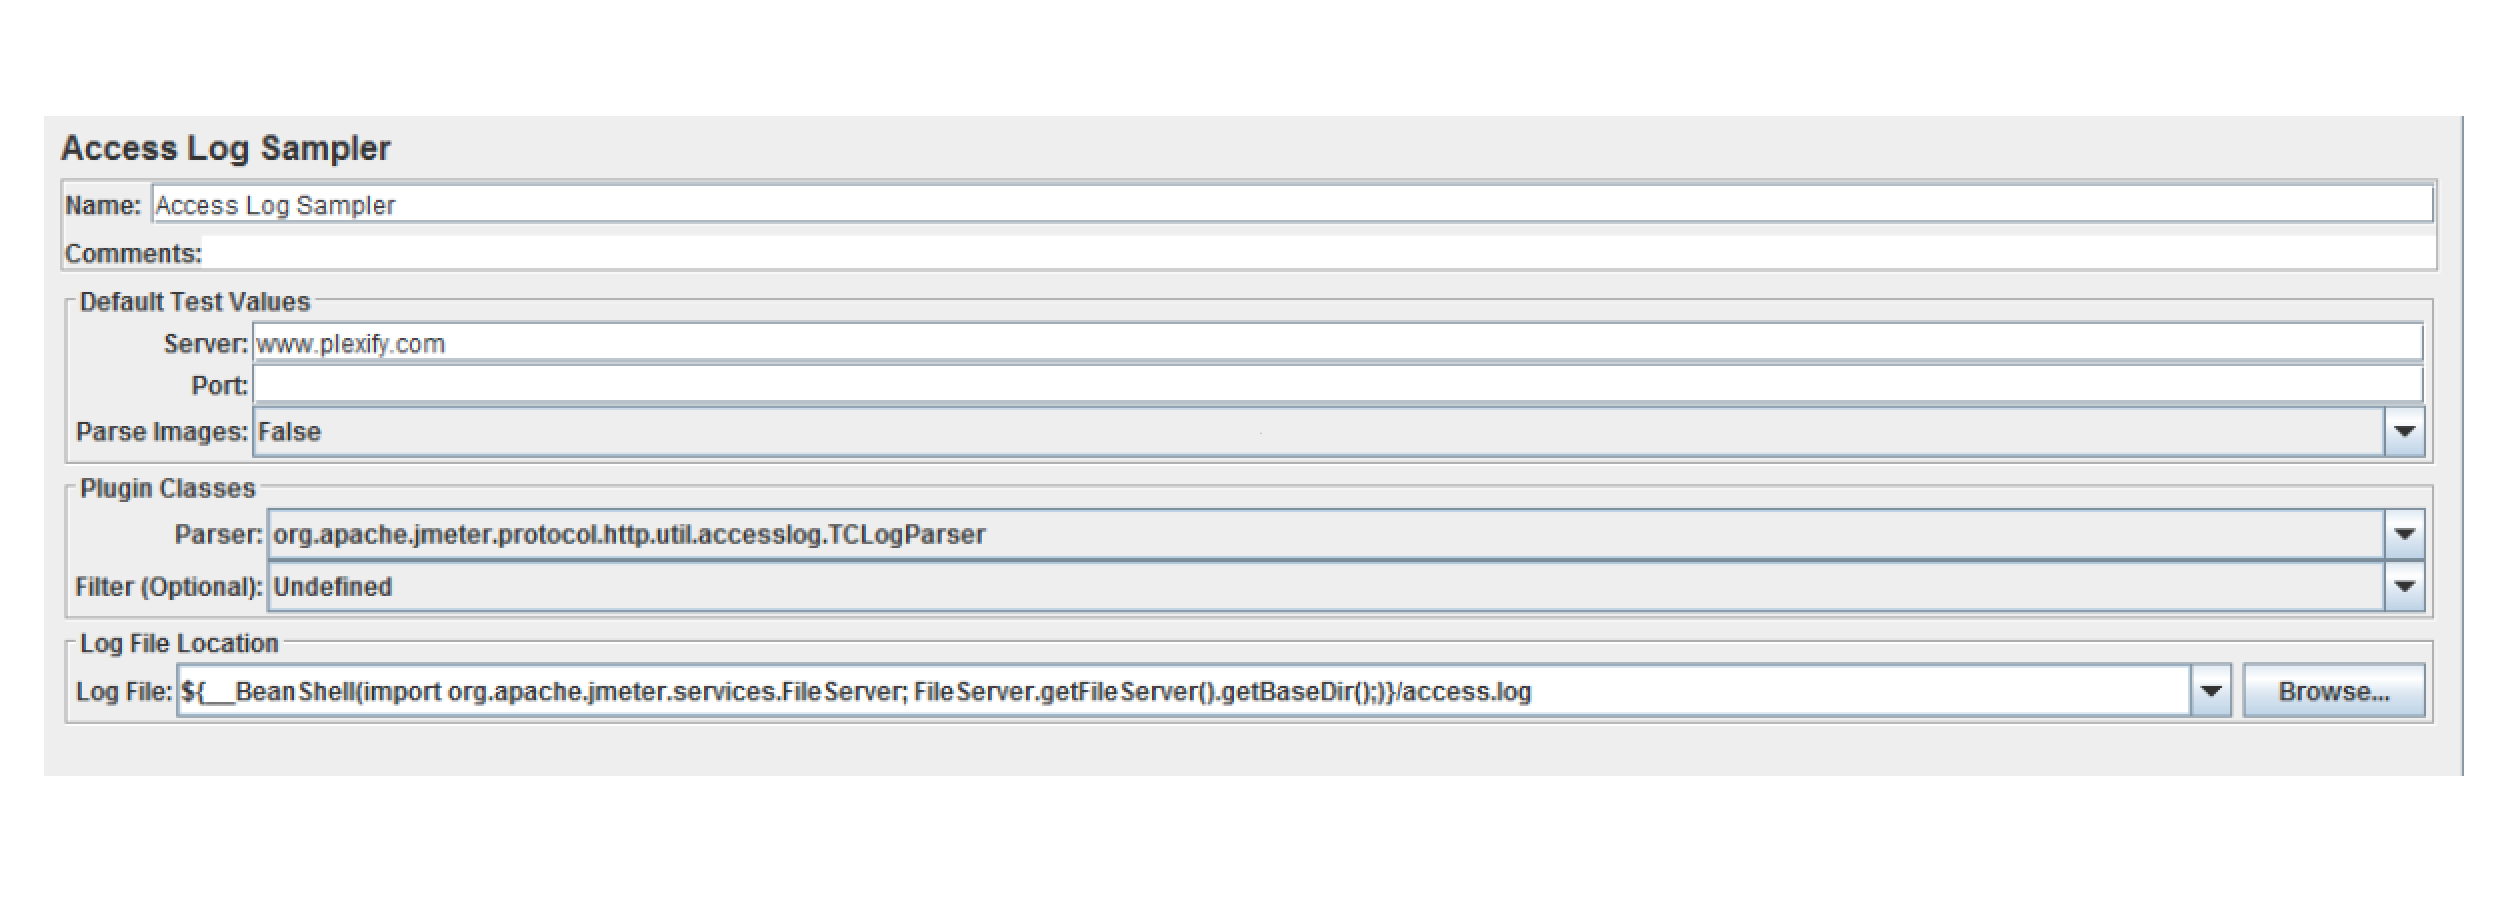
Figure 1: Server: Domain name or the IP address of the web server. All requests will be prefixed with this.
Port: Port the web server is listening to. Also used in forming the proper request URL.
Parse Images: Not implemented.
Log Parser Class: The log parser class is responsible for parsing the logs.
- TCLogParser – Processes access log on each thread
- SharedTCLogParser – Processes log file across many threads
- OrderPreservingLogParser – Processes log file across thread where each thread gets entries in log based on order.
Filter: The filter class is used to filter out or enhance requests.
- LogFilter: Not Implemented
- SessionFilter: Each log entry has cookies sent which are parsed from the log file. Then the session filter will send them along with requests so the GET will be exactly the same as a real call.
Log File Location: Location of the access log file.
- In Figure 1, beanshell method (“${__BeanShell(import org.apache.jmeter.services.FileServer; FileServer.getFileServer().getBaseDir();)}”) is used to get the base directory of the script.
JMeter Note about Log Format
- Log file must be in Apache Commons Logging format which is used by many application and web servers.
- Your threads * loop count must be set properly to allow for each request from the log file to be replayed.
- If your log file has 100 samples and you have 10 threads with loop of 5 only 50 requests will be made.
For more, you can download an example test plan we have set up with our free load testing service that uses the NGINX log file of a web server to generate a load test on an external website.

