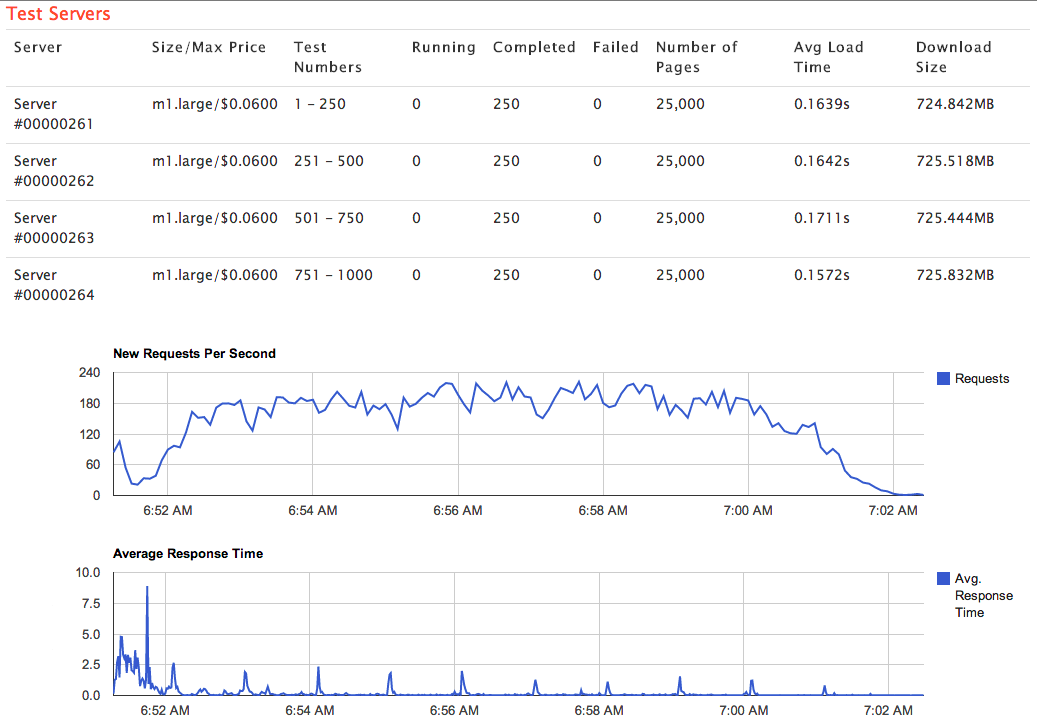
 With the growing number of companies using RedLine for (Almost) Free Load Testing, we are encountering new ways that people are using our service. Last week we had a large user who collected data over a very long time from a number of users and different URL end points. This resulted in a large data set and it frankly broke the way we were displaying data in our graphics.
We have made some nice improvements, that even small tests will benefit from:
- Only list a maximum of 50 unique URLs. This test had thousands.
- Space out time points on the graph based on test duration. Longer tests aggregate on 5 second intervals or 10 second intervals or etc.
- Updated SQL to generate Per Page graphs.
- Added a summary table that compiles the data for the average response time reports as the data comes in.
- Cache the AJAX JSON for the graphs if the test completed.
We hope you note the performance improvements and continue to spread the good word about or Amazon based load testing!
